
How to Build a WFH Dashboard
Spiro WFH Checklist
For optimal visibility, having all of the following on or enabled makes for the best tracking experience. If you have any questions or issues, please contact your CSM.
- Make sure your org has Spiro VOIP enabled
- Make sure every user in the org has Email and Calendar connected and sync working correctly
- Make sure every user has call recording turned on
- Make sure from a process perspective, all outbound calls are done using Spiro. Ideally, inbound calls are handled with Spiro as well instead of using personal numbers.
WFH Dashboard
Please refer to the following example of how this dashboard looks for Spiro:
Here is a screenshot of the dashboard with labels and guidance on the corresponding components: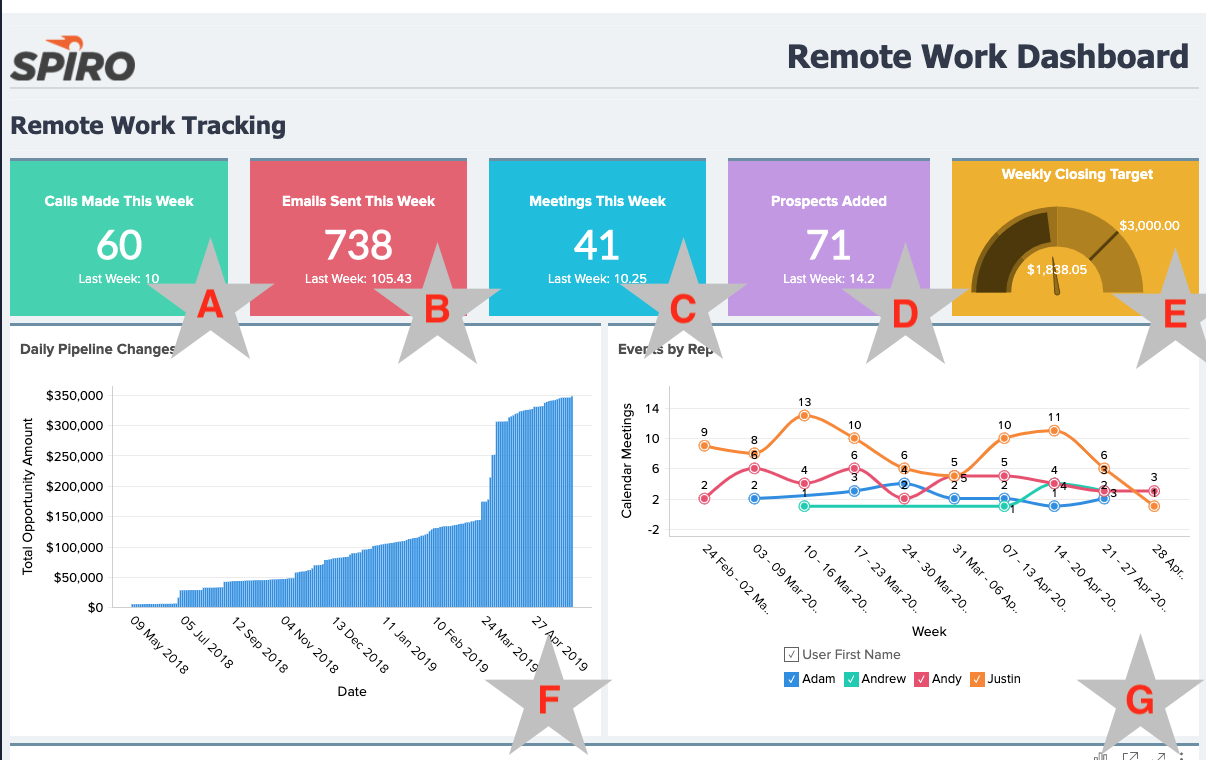

Widgets
Widgets are the smaller, colored number blocks that show quick metrics, comparing this week to last. Please refer to this article to learn more about how they work. They are labeled A - E on the above chart. The following is an explanation of each widget, and how to approach building it. You can feel free to swap out a widget or a report any way you like, based on your own business or metrics.
- [A] Calls made this week vs last week
- When you turn the dashboard into edit mode, add a widget with the following setup:
 The important thing is to have it look at the Activity ID columns, group it by Activity date (week and year) as well as show the primary value as Latest with the Secondary value set to Previous.
 - In the filter section:
 Filter the widget by all types that correspond to outbound calls.
 - In the Settings:
 Change the label to say "Calls Made This Week". In the Secondary value, delete everything in the box except for $(Activity ID).VALUE. Put in "Last Week" before it to show the label as "Last Week". You can also edit the color scheme here as well.
- [B] Emails sent this week vs last week
- Similar instructions to widget A. Differences would be:
- In the filter section, only select options that correlate to Emails
- In the Settings section, have the labels say "Emails Sent This Week" instead of "Calls Sent This Week"
- Similar instructions to widget A. Differences would be:
- [C] Meetings on calendar this week vs last week
- Similar instructions to widget A. Differences would be:
- In the filter section, only select options that correlate to Emails
- In the Settings section, have the labels say "Emails Sent This Week" instead of "Calls Sent This Week"
- Similar instructions to widget A. Differences would be:
- [D] Prospects added this week vs last week
- Similar instructions to widget A. Differences would be:
- In the Data section, the column would be a distinct count of Opportunity ID instead of the Activity ID
- The Group by should be Create Date (Week & Year)
- The filter section can be blank
- In the Settings section, have the labels say "Prospects Added This Week" instead of "Calls Sent This Week"
- In the Data section, the column would be a distinct count of Opportunity ID instead of the Activity ID
- Similar instructions to widget A. Differences would be:
- [E] Weekly Goal widget
- When you turn the dashboard into edit mode, add a widget with the following setup:
 The visualization should be set to Dial Chart. The data columns should be either a SUM of Opportunity Amount or a Distinct count of Opportunity ID ( whichever metric you would prefer to track, amount value, or count). Group by the Opportunity Close date by week & year. For the Select Metrics section, the Value should be either the sum or the count that you selected in the data column. Target and Maximum range should be set to Constant values, where you put in your weekly target value. The maximum range could be a stretch goal for the team.
 - The Filter section can be updated so that only opportunities that have closed this week come into the widget.

- You can change the label of this widget to "Weekly Closing Target" in the settings section.
 The important thing is to have it look at the Activity ID columns, group it by Activity date (week and year) as well as show the primary value as Latest with the Secondary value set to Previous.
  Filter the widget by all types that correspond to outbound calls.
  Change the label to say "Calls Made This Week". In the Secondary value, delete everything in the box except for $(Activity ID).VALUE. Put in "Last Week" before it to show the label as "Last Week". You can also edit the color scheme here as well.
  The visualization should be set to Dial Chart. The data columns should be either a SUM of Opportunity Amount or a Distinct count of Opportunity ID ( whichever metric you would prefer to track, amount value, or count). Group by the Opportunity Close date by week & year. For the Select Metrics section, the Value should be either the sum or the count that you selected in the data column. Target and Maximum range should be set to Constant values, where you put in your weekly target value. The maximum range could be a stretch goal for the team.
Reports
Reports are the larger graphics that show the trends over time, in the chart above they are labeled with F-G. Like the widgets, reports can be subbed out for any report or metric that you like. For a brief overview of how to create reports, please look at this article. The following were the ones we felt were most helpful for remote work management.
- [F] Daily pipeline changes
- Create a report called "Daily Pipeline Changes". Make sure it's a Chart type and on the Opportunities table.
- Have the Settings match the below screenshot - the X-axis should be Opportunity Create Date (Full Date). The Y-Axis should be either Opportunity Amount (SUM) or Opportunity ID (Distinct Count). Make sure the graph type selected is a bar chart.
 Click into the Y-axis function and select the Running Total option. When asked what to base it off, select Create Date (Full Date).
- Filters are optional, based on which opportunities you would like to appear in this report.
- [G] Events by Rep by Week
- Create a report called Events by Rep, and make it a Chart type on the Activities table.
- Have the Graph settings match the following screenshot. Activity Date should be segmented by week, and the Y-axis should be Activity ID (Distinct Count). In the color field, drag the user first name column. Make sure the visual selected is a line chart. To get the rounded lines like in the example, hit the three dots next to the visual selection type and you should be able to pick Smooth line as an option.

- Make sure the filter section is filtered by Interaction Type, and the meeting value is the only one selected.

- [H] Emails sent by Rep by Week
- This is similar to Events by Rep - the only difference is the filter area you would select Outbound Email instead of meeting
- [I] Dials made by Rep by Week
- This is similar to Events by Rep - the only difference is the filter area you would select Outbound Call and Left Voicemail instead of meeting
 Click into the Y-axis function and select the Running Total option. When asked what to base it off, select Create Date (Full Date).

