
Reports: Types of Charts
You can create various types of charts such as Area, Bar, Line, Pie, Stacked, Scatter, Funnel, Web, and 3D charts by simply dragging and dropping the required columns into the respective shelves in the design area.
Before we proceed any further into understanding the chart types and the combination of columns that can be used to create them, it is necessary that we first know about the functions associated with each column.
Listed below are the associated functions used in Spiro Reports:
- Dimension: a column that has discrete values (eg. String and date column).
- Aggregate: a column with an aggregate function applied contains aggregate values like sum, average etc. This even includes aggregate formula columns.
- Measure: The measure column is nothing but a column containing numerical values that can be measured.
The chart designer looks as shown below. You can create charts by simply dragging and dropping the columns in their respected shelves. To know much more in detail about creating charts, you can refer to this help documentation.

The chart types that are not applicable for the combination of columns that you use while creating the chart will appear faded (disabled). Let us now see in detail each chart type and the combination of column types used to create them.
Pie Chart
Pie charts are used to represent percentage or proportional data. A pie chart can be converted to any of its equivalents like ring chart, funnel chart, bar chart, line chart, scatter chart, area chart, or web chart.
Given below is a combination of column types which when dropped in the mentioned shelves will help you generate a pie chart.
| X-axis | Y-axis | Color | Text | Tooltip | |
| Case 1 | Dimension | Aggregate | -- | Aggregate/ Measure/ Optional | Aggregate/ Measure/ Optional |
| Case 2 | Dimension/ Aggregate | Optional | -- | Aggregate/ Measure/ Optional | Aggregate/ Measure/ Optional |
| Case 3 | Optional | Aggregate/ Dimension | -- | Aggregate/ Measure/ Optional | Aggregate/ Measure/ Optional |
Example: Region vs Profit.

Ring Chart
A ring chart or otherwise called a doughnut chart is used to represent data in rings. A ring chart displays the contribution of each value to the overall total expressed in percentage. Ring chart can be converted to any of its equivalents like pie chart, funnel chart, bar chart, line chart, scatter chart, area chart, or web chart.
Given below is a combination of column types which when dropped into their respective shelves as mentioned will generate a ring chart.
| X-axis | Y-axis | Color | Text | Tooltip | |
| Case 1 | Dimension | Aggregate | -- | Aggregate/ Measure/ Optional | Aggregate/ Measure/ Optional |
| Case 2 | Dimension/ Aggregate | Optional | -- | Aggregate/ Measure/ Optional | Aggregate/ Measure/ Optional |
| Case 3 | Optional | Aggregate/ Dimension | -- | Aggregate/ Measure/ Optional | Aggregate/ Measure/ Optional |
Example: Region-wise sales%

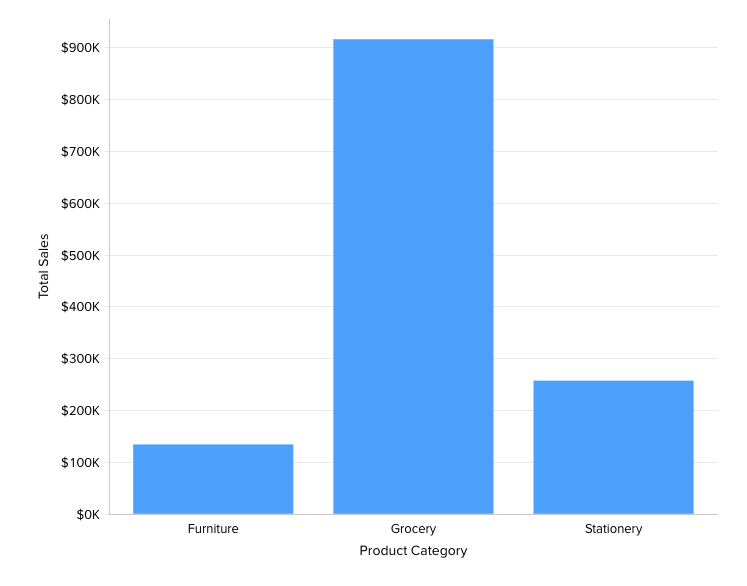
Bar Chart
Bar charts are used when you have to compare data classified into discrete groups. They are generally used to categorize data or represent two or more metrics of a particular category. They display values as individual bars whose height is determined by the value plotted and grouped by each category. A Bar chart can be converted into any of its equivalents like Line, Scatter, Area, Stacked Bar, Stacked Area, or Combo chart depending on the category.
The below combination of column types will help you create a bar chart.
| X axis | Y axis | Color | Text | Tooltip | |
| Case 1 | Dimension | Aggregate | Dimension/ Aggregate/ Measure/ Optional | Aggregate/ Measure/ Optional | Aggregate/ Measure/ Optional |
| Case 2 | Dimension | Multiple Aggregate fields | Dimension/ Aggregate/Measure/ Optional | Aggregate/ Measure/ Optional | Aggregate/ Measure/ Optional |
| Case 3 | Dimension/ Aggregate | Optional | Aggregate/Measure/ Optional | Aggregate/ Measure/ Optional | Aggregate/ Measure/ Optional |
| Case 4 | Optional | Dimension/ Aggregate | Aggregate/Measure/ Optional | Aggregate/ Measure/ Optional | Aggregate/ Measure/ Optional |
Example: Product Category wise sales
Stacked Chart
A Stacked chart allows you to easily analyze the patterns and trends in your data by comparing the parts of your dataset to the whole. In other words, it plots the contribution of each value to the total across categories. There are two types of stacked charts - Stacked Bar and Stacked Area.
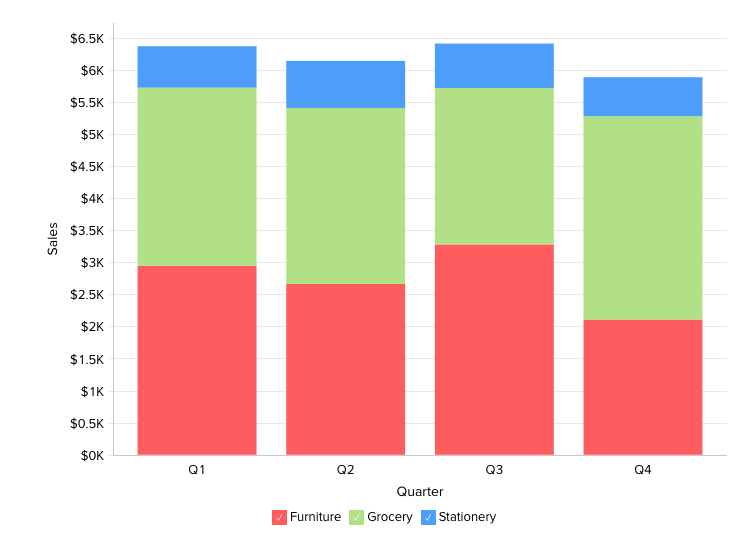
Stacked Bar Chart
You can use the below combination of columns to create a stacked bar chart.
| X axis | Y axis | Color | Text | Tooltip | |
| Case 1 | Dimension | Aggregate | Dimension/ Aggregate/Measure |
Dimension/ Aggregate/ Optional | Dimension/ Aggregate/ Optional |
| Case 2 | Optional | Dimension/ Aggregate | Dimension/ Aggregate/Measure |
Dimension/ Aggregate/ Optional | Dimension/ Aggregate/ Optional |
| Case 3 | Dimension/ Aggregate | Optional | Dimension/ Aggregate/Measure | Dimension/ Aggregate/ Optional | Dimension/ Aggregate/ Optional |
Example: Quarter wise sales for each region.
Stacked Area Chart
You can use the below combination of columns to create a stacked area chart.
| X-axis | Y-axis | Color | Text | Tooltip | |
| Case 1 | Dimension | Aggregate | Dimension/ Aggregate/ Measure | Aggregate/ Optional | -- |
| Case 2 | Dimension | Multiple Aggregate fields | -- | Aggregate/ Optional | -- |
Example: Yearly profit obtained for each product category

Scatter Chart
Scatter charts are commonly used for plotting and comparing numeric values, such as scientific, statistical, and engineering data. It is generally used for comparison between two numerical axes with uneven intervals and ranges. You can interchange a scatter chart with a line chart.
The following combination of column types will help you generate a scatter chart.
| X axis | Y axis | Color | Text | Tooltip | |
| Case 1 | Dimension | Aggregate/ Dimension | Aggregate/ Dimension/ Measure/ Optional | Aggregate/ Dimension/ Measure/ Optional |
Aggregate/ Dimension/ Measure/ Optional |
| Case 2 | Aggregate | Aggregate/ Dimension | Aggregate/ Dimension/ Measure/ Optional | Aggregate/ Dimension/ Measure/ Optional |
Aggregate/ Dimension/ Measure/ Optional |
| Case 3 | Dimension/ Aggregate | Optional | Aggregate/ Dimension/ Measure/ Optional | Aggregate/ Dimension/ Measure/ Optional |
Aggregate/ Dimension/ Measure/ Optional |
| Case 4 | Aggregate/ Dimension | Optional | Aggregate/ Dimension/ Measure/ Optional | Aggregate/ Dimension/ Measure/ Optional |
Aggregate/ Dimension/ Measure/ Optional |
Example: Temperature Vs Rainfall

Line Chart
A line chart is used to analyze data series trends across a time period. You can interchange a line chart with a scatter chart.
Any of the below combinations of column types will generate a line chart.
| X axis | Y axis | Color | Text | Tooltip | |
| Case 1 | Dimension | Aggregate/ Dimension/ Optional | Dimension/ Aggregate/ Measure/ Optional | Dimension/ Aggregate/ Measure/ Optional | Dimension/ Aggregate/ Measure/ Optional |
| Case 2 | Optional | Aggregate/ Dimension | Dimension/ Aggregate/ Measure/ Optional | Dimension/ Aggregate/ Measure/ Optional | Dimension/ Aggregate/ Measure/ Optional |
| Case 3 | Aggregate/ Dimension | Optional | Dimension/ Aggregate/ Measure/ Optional | Dimension/ Aggregate/ Measure/ Optional | Dimension/ Aggregate/ Measure/ Optional |
Example: Running Sales vs Cost vs Profit.

Combination Chart
The combination chart is a combination of bar and line charts and is used when you have a mixed type of data to represent.
The following combination of column types can be used to create a combination chart.
| X-axis | Y-axis | Color | Text | Tooltip | |
| Case 1 | Dimension | Multiple Aggregate fields | -- | -- | -- |
| Case 2 | Dimension | Multiple Aggregate fields | -- | Aggregate | Aggregate |
Please do note that you cannot build a combination chart when the Color shelf is occupied.
Example: Profit Vs Sales-if total sales across products are represented in bars, the profit can be represented as an individual line in the same chart.

Area Chart
Area charts shade the area beneath the lines and therefore help you more readily compare data magnitudes. They are mainly useful for emphasizing the change in metrics across time. You can interchange an area chart with a web chart.
Given below is a combination of column types that will help you generate an area chart.
| X axis | Y axis | Color | Text | Tooltip | |
| Case 1 | Dimension | Aggregate | Dimension/ Aggregate/ Measure/ Optional | -- | -- |
| Case 2 | Dimension | Aggregate | Dimension/ Aggregate/ Measure/ Optional | Aggregate | Aggregate |
Example: Year-wise Sales

Funnel Chart
The funnel chart is used to represent a progressive flow/reduction of a business metric across phases.
The below combination of column types can be used to create a funnel chart.
| X-axis | Y-axis | Color | Text | Tooltip | |
| Case 1 | Dimension | Aggregate | -- | Aggregate/ Measure/ Optional | Aggregate/ Measure/ Optional |
| Case 2 | Optional | Aggregate | -- | Aggregate/ Measure/ Optional | Aggregate/ Measure/ Optional |
Example: Sales Pipeline - To visualize potentials across each stage

Web Chart
Web charts help in studying the comparison between different data series. It compares the values of a number of data series represented with data markers in proportion with a center point.
Given below is a combination of column types that will help you generate a web chart.
| X-axis | Y-axis | Color | Text | Tooltip | |
| Case 1 | Dimension | Aggregate | Dimension/ Optional | -- | Aggregate/Measure/ Optional |
Example: Cost Vs Sales for 2016
